
The RIAA’s annual revenue figures for recorded music are a goldmine of information about the state, health, and direction of the music industry. The 2016 figures that the RIAA published at the end of March generated a few common headlines in the trade and business press:
- Recorded music revenue in the United States is finally growing again, up 11% over last year after five years of flat-to-slight-decline;
- Subscription streaming revenue growth accelerated, more than doubling since 2015. It is now the majority source (51%) of recorded music revenue, even counting CDs and other physical products;
- The vinyl renaissance is hitting its limits, as growth has slowed and vinyl looks headed for a new peak of 6% of total industry revenue.
But beneath those headlines lie a few more developments which indicate fundamental tipping points in music’s digital transformation.
First, and most relevant to us here, is something I’ve predicted but the RIAA numbers make it official: encrypted digital music accounts for more revenue than DRM-free music (digital or analog). In other words — if you define DRM as any encrypted means of content delivery — DRM for music is back.
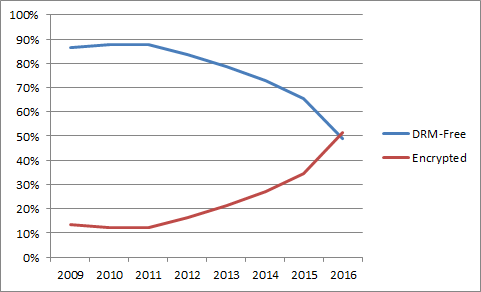
Percentage of recorded music revenue from DRM-free vs. encrypted sources, 2009-2016. Data source: RIAA.
Compare this figure with the one showing estimates I extrapolated from the RIAA’s revenue numbers for the first half of 2016. That shows the percentage of digital (not physical) recorded music revenue that comes from DRM-free vs. encrypted sources. It turns out that I underestimated the growth of subscription streaming from 2015 to last year, and now only 30% of digital music comes from DRM-free sources while 70% is encrypted in some way. The above graph shows that the majority of all recorded music revenue — counting physical products — now comes through encrypted digital channels. The transition point occurred sometime last year.
The only modes of digital music delivery that don’t use encryption today are CDs, downloads (except for some ringtones), and many simulcast streams of AM/FM radio signals. CDs have fallen far from their peak in 1999 and now account for only 15% of total revenue. Download revenue is also in free-fall and now accounts for 24% of total revenue. Revenue from AM/FM simulcasts is hard to figure, but it’s negligible: most of it comes through the digital radio royalty administrator SoundExchange, which doesn’t break out revenue by type of source; but I would put it at roughly 10% of SoundExchange collections or 1% of total revenue.
An even more important indication of change is the shift in consumer preference from ownership to access models. This won’t come as a shock to those who have been watching the music industry evolve for a while, but it’s reality now: people have found that when music is available everywhere on any device, it’s not so important to own it anymore. As we’ll see, this is now music listeners’ majority view.
Ownership models include all physical products — CDs, vinyl, tapes, etc. — as well as downloads. The question of whether you actually own music you got in the form of digital downloads is legally fraught, but because users assume that they get ownership benefits from downloads (not to mention that they are marketed as such), I include downloads in “ownership” models (and maintain quotation marks to preserve the ambiguity).
Access models could be said to include all non-ownership models. Here’s where measurement gets tricky. Non-ownership models include all streaming models — not just on-demand but also AM/FM simulcasts, pure-play Internet radio (Pandora, iTunes Radio, etc.), satellite radio (Sirius XM), business establishment services such as Mood Media (f/k/a Muzak and DMX), and music channels on cable TV (Music Choice).
More importantly, the non-ownership category also includes AM/FM broadcast radio. This is by far the biggest source of music listenership, even today: total songs heard by radio listeners last year were more than four times that of on-demand streaming, according to Nielsen Audio numbers.* The RIAA doesn’t track revenue from terrestrial broadcast radio for the simple reason that record labels don’t earn any revenue from it in the United States.
(The music publishing industry does earn a significant amount from radio airplay. It doesn’t break out revenues on compositions by source as the RIAA does for sound recordings, but based on data from the NMPA and ASCAP, radio accounts for roughly 9% of revenue to music publishers and songwriters.)
It’s reasonable to argue that both broadcast and Internet radio don’t offer as much engagement with music as on-demand access does (e.g., radio is often on in the background — as it is while I type this). And there’s no conventional guidance for equating radio play to purchases, which — as we’ll see shortly — there is for on-demand streams. So to compare ownership to access models, it’s most conservative to focus solely on on-demand access models, both paid and ad-supported.
On the basis of recorded music revenue, we get this:
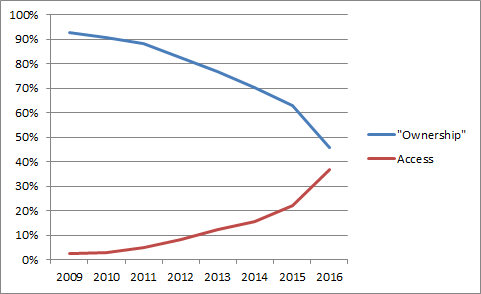
Percentage of recorded music revenue from “ownership” and access models, 2009-2016. Data source: RIAA.
This indicates that access should surpass “ownership” sometime this year.
Advocates of digital content ownership will no doubt point out that a majority of revenue from access models does not necessarily mean that consumers prefer them over ownership models. A significant chunk of revenue from access models comes from free ad-based on-demand services such as YouTube, Spotify Free, and Vevo. If we break that revenue out separately, we get this:
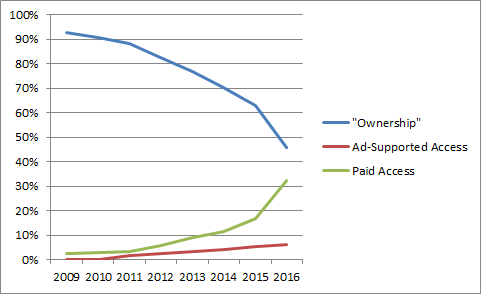
Percentage of recorded music revenue from “ownership,” ad-supported access, and paid access models, 2009-2016. Data source: RIAA.
Yet this doesn’t change the prediction that access should surpass “ownership” sometime this year, even when consumers vote with their wallets.
Next, let’s note that we’ve been measuring the music industry transition in terms of record industry revenue, not actual music consumption. The RIAA doesn’t measure music consumption. But Nielsen does.
Nielsen Music has been tracking total on-demand music streams in the U.S. per year since 2012. We can compare these numbers to the RIAA’s data by using the RIAA’s data on unit sales volume (as opposed to revenue), by using two heuristics: Nielsen currently uses a 150:1 ratio to convert streams to downloads of a track and a 10:1 ratio of tracks per album. (The RIAA also uses these ratios to count streams towards its Gold and Platinum awards.) If we apply these ratios, here’s what we get:
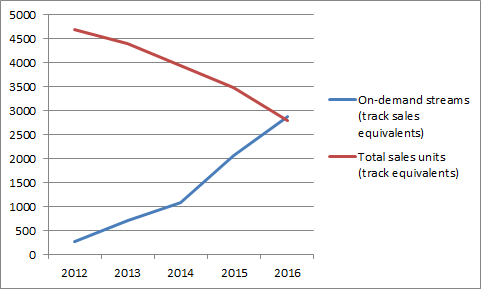
Unit volume of music track sales vs. on-demand streaming equivalents, 2012-2016, millions. Data sources: RIAA (unit sales), Nielsen Music (on-demand streams).
In other words, on a consumption basis, people now already prefer access-based models to music purchases, and the crossover point was sometime last year.
Finally, a legitimate objection to these theories about the transition to digital music is that it doesn’t take into account infringement, a/k/a the p-word that I don’t like to use. There are endless arguments over the impact of the p-word on industry revenues, though the general consensus is that it harms them by some amount. Yet one thing is for sure: whereas piracy only used to take place via downloads (e.g., P2P file-sharing or offshore direct download sites), nowadays it also takes place through access models (e.g., unauthorized music on YouTube that slipped past YouTube’s Content ID system). How this all tips the balance of access vs. “ownership” — or of DRM-free vs. encrypted — will be anyone’s guess for some time to come.
*Nielsen Audio figures compiled by the Radio Advertising Bureau show that 91% of the U.S. 12+ population of 247.4 million listened to radio in 2016, and average total weekly time spent listening is 13.6 hours. A 2009 Mediaguide study put the average number of songs per hour played on radio, across all formats, at 11. That’s a total of 1.75 trillion songs per year. Nielsen Music counted 432 billion on-demand streams last year.


[…] Link to the rest at Copyright and Technology […]
“The only modes of digital music delivery that don’t use encryption today are CDs, downloads (except for some ringtones), and many simulcast streams of AM/FM radio signals.”
Vinyl too, surely?
I said “digital music delivery.”
[…] consumers, convenience is king. That’s about the only conclusion I can take from a recent post on the blog Copyright and Technology interpreting recent RIAA statistics to demonstrate that, where music is concerned, “DRM is […]
[…] In Music, DRM Is Back While Ownership Is Going Away (Copyright and Technology) […]